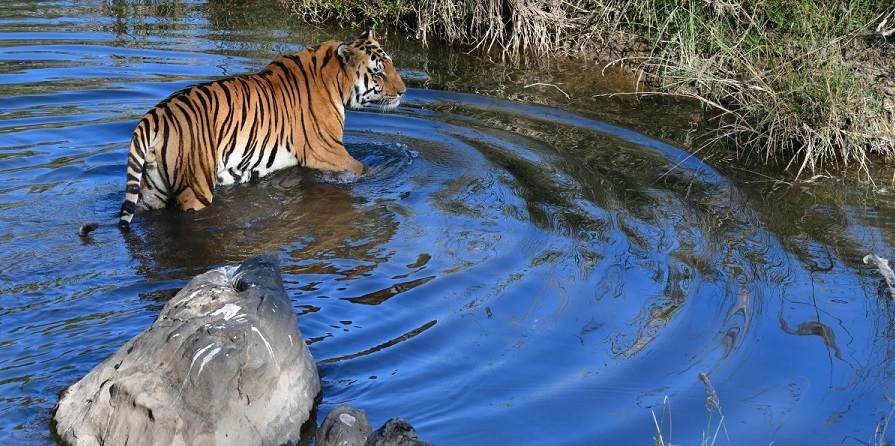
One of the extremely important tasks for the management of the Tiger Reserve is to know the number of tigers and wild animals of all species for their effective conservation. To understand whether the population is increasing, decreasing, or stable one needs to monitor the trend of these populations. Such information is vital to examine the changes in population trends over time or among habitats and analyzes the success of the wildlife management programs in the safeguarded area.
Pugmark Method
The Pugmark Method is still employed to count tigers, leopards, and other co-predators during winters for several years. Involving a large number of personnel during the estimation week, the estimation of the tiger population in the tiger reserve was used to be conducted by the “Cooperation Census” methodology. The Method was first employed in April 1972 to conduct the first country-wide census of tigers by counting pugmarks in the light of old records and interviews concerning tiger hunts and the presence and absence of information in different parts of the country. Training thousands of personnel, tracing of pugmarks throughout the country,and later analyzing to arrive at a conclusion about the total number of tigers.
This indirect method of counting tigers, taken as a total count is based on the identification and documentation of the pugmarks of tigers, tigresses, and their cubs in the wild.
Adopted a few years back, this was considered the most reliable, cost-effective, and user-friendly method. Every day the staff searched for the pugmarks all over the Safari zones in Kanha and the imprinted pugmarks on the soil covers of forest roads, fire lines, and especially prepared pressure impression pads (PIPs) and the nearby water bodies which are secured, traced and made into plaster casts with relevant details. As per the rule, only the left rear pugmark is taken into account for the counting exercise.
All such data on pugmarks were validated with a lot of other information recorded by the forest guards throughout their routine patrols and analysis before arriving at a range of tiger populations in the core zone.
Flaws in the Method
Since the method was supposed to have many shortcomings arising from the grossly undercount or over count of tigers, it was restored by the new and holistic protocol conceptualized and successfully tested in a joint pilot project of the MP Forest Department.
New Technologies
In the above-mentioned scenario, some forest officers and field biologists came up with new technologies and methodologies and a comprehensive evaluation protocol known as the “Monitoring Tigers, Co-Predators, Preys, and their Habitats”. For examining and estimating the tiger habitats in the Satpura-Maikal Landscape of Madhya Pradesh, the proposed new technique was at a large scale was tested in a pilot project of the MP Forest Department.
Broadly divided into two components i.e. intensive and extensive data collection in the field The Intensive data collection is carried out by the technical persons whereas the extensive data collection is carried out by the forest guards in their respective beats. The Field data is collected in six prescribed formats and is later furnished with a lot of relevant spatial information on the signs of carnivores, vegetation, sightings of the ungulate species, human disturbance, and herbivore pellets. Besides these, the other attribute information like forest types, livestock and human density, road network, meteorological information, poaching pressure, and the socioeconomic parameter are also acquired from the forest department as the secondary data, and further relevant satellite data/imageries and vegetation map are used for the final analysis processes.
Additionally, under intensive field data collection, trained researchers collect the data in their respective sampling areas conducted throughout the state using standard methodologies like camera traps and effective data verification. In addition to this, DNA profiles prepared from the escape of the tigers and the digital photography of the pugmarks in the tiger reserves give insights into the tiger populations.
The Collected Data is further analyzed in Geographical Information System (GIS) and using the various statistical frameworks the tiger occupancy and population range in different forest units of the state. The Camera Trapping Technique is based on vigorous statistical design and is also utilized to photograph the tigers in real-time throughout the tiger reserve. The Interpretation of the image data gives admissible results of the total tiger number in the reserve.
Giving in totality a picture of the tiger population, prey base, and the other carnivores with the general health of the tiger’s habitat in the state, all this results in the form of maps, indices, and classes. For the continuous monitoring and evaluation of tigers and their habitats in every tiger landscape complex in the country, experts say that the method can be institutionalized.


